We published a preprint on arXiv, in which we question the current practice of calculating evaluation metrics for recommender systems as single numbers (e.g. precision p=.28 or mean absolute error MAE = 1.21). We argue that single numbers express only average effectiveness over usually a rather long period (e.g. a year or even longer). This practice provides only a vague and static view of the data. We propose that recommender-system researchers should instead calculate metrics for time-series such as weeks or months, and plot the results in e.g. a line chart. This way, results show how algorithms’ effectiveness develops over time, and hence the results allow drawing more meaningful conclusions about how an algorithm will perform in the future. In this paper, we explain our reasoning, provide an example to illustrate our reasoning and present suggestions for what the community should do next.
1. Introduction
Recommender-system evaluation is an actively discussed topic in the recommender-system community. Discussions include advantages and disadvantages of evaluation methods such as online evaluations, offline evaluations, and user studies [1–4]; the ideal metrics to measure recommendation effectiveness[1] [5–8]; and ensuring reproducibility [9–11]. Over the last years, several workshops about recommender-system evaluation were held and journals published several special issues [11–14].
An issue that has received (too) little attention is the question if presenting results as a single number is sufficient or if metrics should be presented for time intervals. Typically, researchers calculate a few metrics for each algorithm (e.g. precision p, normalized discounted cumulative gain nDCG, root mean square error RMSE, mean absolute error MAE, coverage c, or serendipity s). For each metric, they present a single number such as p = 0.38, MAE = 1.02, or c = 97%, i.e. the metrics are calculated based on all data available. Hence, the metrics express how well an algorithm performed on average over the period of data collection, which is often rather long. For instance, the data in the MovieLens 20m dataset was collected over ten years [15]. This means, when a researcher reports that an algorithm has e.g. an RMSE of 0.82 on the MovieLens dataset, the algorithm had that RMSE on average over ten years.
2. The Problem: Single-Number Metrics
We argue that presenting a single number that expresses the overall average is problematic as an average provides only a broad and static view of the data. If someone was asked how an algorithm had performed over time – i.e. before, during, and after the data collection period, the best guess, based on a single number, would be that the algorithm had the same effectiveness all the time.
Consider the following example: A researcher aims to compare the effectiveness of algorithms A and B. She receives 12-months-usage data from a recommender system in which the two algorithms have been used[2]. The researcher calculates for algorithms A and B a metric (e.g. precision) to express the algorithms’ effectiveness (a real researcher would probably calculate more than one metric but to illustrate our point, one metric is sufficient). The outcome of such an evaluation would typically be a chart as presented in Figure 1. The chart shows the effectiveness for algorithm A (0.48) and for algorithm B (0.67). The interpretation of these results would be that algorithm B is more effective than algorithm A, and algorithm B should be used in a recommender system rather than algorithm A.

Figure 1: Results from a hypothetical, yet typical, evaluation of two recommendation algorithms A and B
If someone was asked how algorithms A and B had performed in the past, and will perform in the future, the best guess would be that the algorithms’ effectiveness was stable and will remain stable over time. This assumption is illustrated in Figure 2.

Figure 2: Effectiveness of algorithms A and B over time. The numbers are best-guesses based on the results in Figure 1. The time during which data was collected are months M1 to M12, the time before the data collection period are months M-1 and M-2, and the time after the data collection period are months M13 and M14.
We argue that such assumptions are naïve, as many algorithms’ effectiveness is not stable over time. It is well known that the effectiveness of many recommendation algorithms depends on the number of users, items, and ratings as well as algorithm’s parameters such as neighbourhood size or user model size [16–19]. As the numbers of users etc. are likely to change over time, also the effectiveness of the algorithms will change over time. We have observed this effect in our own recommender systems Docear [20] and Mr. DLib [21], as have Middleton, Shadbolt, & De Roure [22] and Jack from Mendeley [23]. For instance, Jack reports that precision increased from 0.025 when Mendeley launched its recommender system to 0.4 after six months. Also Netflix emphasizes the importance of considering time in recommender systems [24].
3. Our Proposal: Temporal Evaluation
We propose that, instead of a single number, recommender-systems researchers should present metrics for time series, i.e. each metric should be calculated for a certain interval of the data collection period, e.g. for every day, week, or month. This will allow to gain more information about an algorithm’s effectiveness over time, identify trends, make better predictions on how an algorithm will perform in the future, and hence to make more meaningful conclusions on which algorithms to deploy in a recommender system.
Calculating effectiveness for each month would lead to a chart like in Figure 3, given the data from the previously introduced example. The chart shows that effectiveness of algorithm A improves over time from 0.14 in the first month of the data collection period to 0.90 in the last month. In contrast, the effectiveness of algorithm B decreases from 0.83 to 0.53. Most importantly, the chart shows that algorithm A outperformed algorithm B from month nine onwards.
Even though Figure 1 and Figure 3 are based on the same (hypothetical) data, Figure 3 is more meaningful than Figure 1. Based on Figure 1, one would conclude that algorithm B is more effective than algorithm A. Based on Figure 3, a more differentiated conclusion can be drawn, namely that algorithm B was only more effective during the first months, but after month 9, algorithm A was more effective, and looking at the trend it seems likely that algorithm A will continue to be the more effective algorithm in the future.
We, therefore, propose that recommender-system researchers should calculate their metrics for time-intervals of the data collection period, and present them in line plots as shown in Figure 3. Similarly, reviewers and organizers of conferences and journals should encourage the submitting authors to present their results as time series, when possible. Also, researchers who publish datasets should include time information such as when a user registered or when a rating was made.

Figure 3: Hypothetical results from the same evaluation as in Figure 1, but plotted over time with monthly averages. Months M1-M12 are based on the available data. Months M-1, M-2, M13, and M14 are predicted.
It is a common practice already to analyze how algorithms react to changes in the algorithms’ parameters or the number of items and users in a dataset [16], [19]. Researchers analyze, for instance, how effective an algorithm is with a neighborhood size of two, three, four, etc. or how effectiveness changes based on the number of data points in a dataset. While these information certainly is relevant, no one currently knows, how many and which variables affect an algorithm’s effectiveness [10]. Therefore, it is not possible to present a comprehensive analysis of all variables effecting an algorithm’s effectiveness. We consider ‘time’ to be a good aggregate, and we think that knowing how an algorithm’s effectiveness changes over time is at least equally important as knowing how it changes based on variations in e.g. neighborhood size, user model size or the number of users.
4. Related Work
“Time” has been considered in recommender-system research, though usually not for evaluations. The user-modelling community considers time in terms of concept drift, i.e. changes in user preferences over time [25–32]. Their focus lies on adjusting algorithms to make them consider time and improve the effectiveness of the algorithms. “Time” has also been considered as contextual feature, i.e. depending on the temporal context (e.g. summer or winter), different recommendations should be given [33–36], or different algorithms should be used [10]. There is also work on enhancing recommendation algorithms by considering temporal data, mostly in the field of collaborative filtering [37–41]. Again, this work focuses on incorporating temporal data into the algorithms. The machine-learning community sometimes considers how temporal aspects can be taken into account for training and testing algorithms, and how predictions for time-series can be made [33], [42], [43]. For instance, typical k-fold cross validations may be adjusted to not randomly pick training and test data, but train algorithms only on data from a certain period, and evaluate the algorithm on data from the subsequent period (illustrated in Figure 4). Similarly, re-training machine-learning systems after certain periods is a common research topic [44].
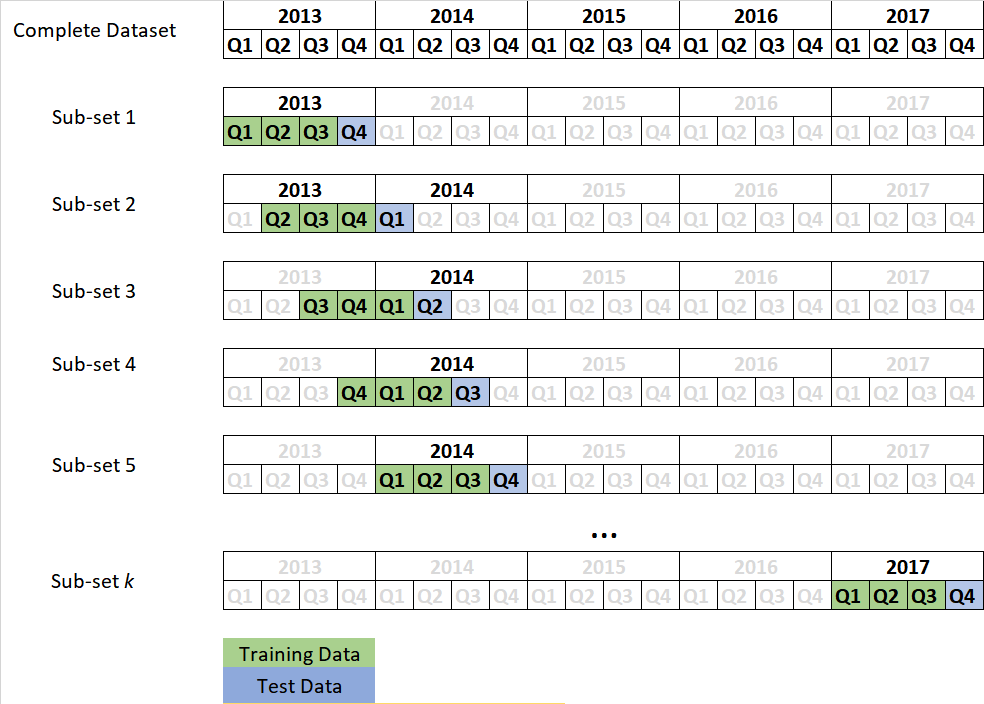
Figure 4. Illustration of time-aware machine-learning training and testing
To the best of our knowledge, there has been little work on how to calculate and present evaluation metrics over certain time periods. In addition, even though there has been some work, the majority of the recommender system community seems not yet to consider it, i.e. it continues to present single number results. Rana & Jain developed a time-aware book recommender system and evaluated it per week and quarter [45]. However, they did not evaluate the performance over time but the preferences of the users, i.e. if users preferred rather diverse or similar recommendations (the users´ preferences changed over time). Lathia et al. showed that a “most popular” recommendation algorithm on the MovieLens dataset converges towards a random baseline over time. Soto evaluated several algorithms with different metrics on the Movielens 1m dataset and plotted the effectiveness of the algorithms over a period of 20 months [46]. The results show that effectiveness of the algorithms often varies over time. However, only in few cases, the variations were so strong, that a conclusion about which algorithm was most effective would have changed compared to looking at single number results.
5. Next Steps
We used a hypothetical example to demonstrate the need for time-based evaluation metrics. The related work shows a few examples in which algorithms´ performance varies over time, but the variations were usually not very strong. Consequently, we first need to identify if and to what extent the need for evaluating recommender systems over time really exists. We suggest to analyze existing datasets such as MovieLens [47], RARD [47], Docear [20] or other datasets. The analyses should calculate metrics for different algorithms over time, to see if and how strong the effectiveness of algorithms changes. It will be particularly interesting to see how often the change is so strong that the conclusions about which of two algorithms is more effective will change. To further quantify the problem, a literature survey could be conducted to find out how many researchers currently present single-number metrics, and how often time-series metrics might make sense. A suitable corpus to analyze would be the full papers from the previous ACM Recommender Systems conferences (see appendix).
If the research confirms our assumptions, specific time-series metrics need to be created. One option would be, as done in the example, to calculate each metric e.g. per month and plot the results in a chart. However, in some cases, space restrictions might prevent researchers from presenting numbers for each interval. In such cases, it might be sensible to present the min, max, and average values for the intervals as well as standard deviation; or the values for the first and last month and/or a trend function. The community should also agree on notations for the time-series metrics. For instance, to express precision p in interval i, the metric could be labelled p@i (e.g. p@m5 to express average precision in the fifth month).
References
[1] J. Beel and S. Langer, “A Comparison of Offline Evaluations, Online Evaluations, and User Studies in the Context of Research-Paper Recommender Systems,” in Proceedings of the 19th International Conference on Theory and Practice of Digital Libraries (TPDL), 2015, vol. 9316, pp. 153–168.
[2] G. G. Gebremeskel and A. P. de Vries, “Random Performance Differences Between Online Recommender System Algorithms,” in Experimental IR Meets Multilinguality, Multimodality, and Interaction: 7th International Conference of the CLEF Association, CLEF 2016, Évora, Portugal, September 5-8, 2016, Proceedings, N. Fuhr, P. Quaresma, T. Gonçalves, B. Larsen, K. Balog, C. Macdonald, L. Cappellato, and N. Ferro, Eds. Cham: Springer International Publishing, 2016, pp. 187–198.
[3] G. de S. P. Moreira, G. A. de Souza, and A. M. da Cunha, “Comparing Offline and Online Recommender System Evaluations on Long-tail Distributions.,” in Proceedings of the ACM Recommender Systems Conference RecSys, 2015.
[4] M. Rossetti, F. Stella, and M. Zanker, “Contrasting Offline and Online Results when Evaluating Recommendation Algorithms,” in Proceedings of the 10th ACM Conference on Recommender Systems, 2016, pp. 31–34.
[5] C. C. Aggarwal, “Evaluating Recommender Systems,” in Recommender Systems: The Textbook, 2016, pp. 225–254.
[6] A. Bellogin, P. Castells, and I. Cantador, “Precision-oriented Evaluation of Recommender Systems: An Algorithmic Comparison,” in Proceedings of the Fifth ACM Conference on Recommender Systems, 2011, pp. 333–336.
[7] D. Jannach and G. Adomavicius, “Recommendations with a Purpose,” in Proceedings of the 10th ACM Conference on Recommender Systems, 2016, pp. 7–10.
[8] S. M. McNee, J. Riedl, and J. A. Konstan, “Being accurate is not enough: how accuracy metrics have hurt recommender systems,” in CHI’06 extended abstracts on Human factors in computing systems, 2006, pp. 1097–1101.
[9] L. Çoba and M. Zanker, “Replication and Reproduction in Recommender Systems Research – Evidence from a Case-Study with the rrecsys Library,” in Advances in Artificial Intelligence: From Theory to Practice: 30th International Conference on Industrial Engineering and Other Applications of Applied Intelligent Systems, IEA/AIE 2017, Arras, France, June 27-30, 2017, Proceedings, Part I, 2017, pp. 305–314.
[10] J. Beel, C. Breitinger, S. Langer, A. Lommatzsch, and B. Gipp, “Towards Reproducibility in Recommender-Systems Research,” User Modeling and User-Adapted Interaction (UMUAI), vol. 26, no. 1, pp. 69–101, 2016.
[11] A. Bellogin, P. Castells, A. Said, and D. Tikk, “Report on the workshop on reproducibility and replication in recommender systems evaluation (RepSys),” in ACM SIGIR Forum, 2014, vol. 48, no. 1, pp. 29–35.
[12] P. Adamopoulos, A. Bellog?n, P. Castells, P. Cremonesi, and H. Steck, “REDD 2014 – International Workshop on Recommender Systems Evaluation: Dimensions and Design,” in Proceedings of the 8th ACM Conference on Recommender Systems, 2014, pp. 393–394.
[13] P. Cremonesi, A. Said, D. Tikk, and M. X. Zhou, “Introduction to the Special Issue on Recommender System Benchmarking,” ACM Trans. Intell. Syst. Technol., vol. 7, no. 3, pp. 38:1–38:4, 2016.
[14] M. Willemsen, D. Bollen, and M. Ekstrand, “UCERSTI 2: Second Workshop on User-centric Evaluation of Recommender Systems and Their Interfaces,” in Proceedings of the Fifth ACM Conference on Recommender Systems, 2011, pp. 395–396.
[15] F. M. Harper and J. A. Konstan, “The movielens datasets: History and context,” ACM Transactions on Interactive Intelligent Systems (TiiS), vol. 5, no. 4, p. 19, 2016.
[16] I. Fernández-Tob?as, M. Braunhofer, M. Elahi, F. Ricci, and I. Cantador, “Alleviating the new user problem in collaborative filtering by exploiting personality information,” User Modeling and User-Adapted Interaction, vol. 26, no. 2–3, pp. 221–255, 2016.
[17] S. Roy and S. C. Guntuku, “Latent factor representations for cold-start video recommendation,” in Proceedings of the 10th ACM Conference on Recommender Systems, 2016, pp. 99–106.
[18] A. I. Schein, A. Popescul, L. H. Ungar, and D. M. Pennock, “Methods and metrics for cold-start recommendations,” in Proceedings of the 25th annual international ACM SIGIR conference on Research and development in information retrieval, 2002, pp. 253–260.
[19] B. Sarwar, G. Karypis, J. Konstan, and J. Reidl, “Item-Based Collaborative Filtering Recommendation Algorithms,” in Proceedings of the 10th International Conference on World Wide Web, 2001, pp. 285–295.
[20] J. Beel, S. Langer, B. Gipp, and A. Nürnberger, “The Architecture and Datasets of Docear’s Research Paper Recommender System,” D-Lib Magazine, vol. 20, no. 11/12, 2014.
[21] J. Beel, A. Aizawa, C. Breitinger, and B. Gipp, “Mr. DLib: Recommendations-as-a-Service (RaaS) for Academia,” in Proceedings of the ACM/IEEE-CS Joint Conference on Digital Libraries (JCDL), 2017.
[22] S. E. Middleton, N. R. Shadbolt, and D. C. De Roure, “Ontological user profiling in recommender systems,” ACM Transactions on Information Systems (TOIS), vol. 22, no. 1, pp. 54–88, 2004.
[23] K. Jack, “Mendeley: Recommendation Systems for Academic Literature,” Presentation at Technical University of Graz (TUG). 2012.
[24] J. Basilico and Y. Raimond, “DéJà Vu: The Importance of Time and Causality in Recommender Systems,” in Proceedings of the Eleventh ACM Conference on Recommender Systems, 2017, pp. 342–342.
[25] I. Žliobait, M. Pechenizkiy, and J. Gama, “An overview of concept drift applications,” in Big Data Analysis: New Algorithms for a New Society, Springer, 2016, pp. 91–114.
[26] D. Barua, “A time to remember, a time to forget: User controlled, Scalable, Life long user modelling.,” The University of Sydney, Australia, 2016.
[27] V. Bogina, “Addressing Temporal Aspects in User Modelling,” in Adjunct Publication of the 25th Conference on User Modeling, Adaptation and Personalization, 2017, pp. 113–114.
[28] V. Bhardwaj and R. Devarajan, “Probabilistic user modeling in the presence of drifting concepts,” Advances in Knowledge Discovery and Data Mining, pp. 328–339, 2010.
[29] R. Klinkenberg and T. Joachims, “Detecting Concept Drift with Support Vector Machines.,” in ICML, 2000, pp. 487–494.
[30] R. Klinkenberg and I. Renz, “Adaptive Information Filtering: Learning in the Presence of Concept Drifts,” 1998.
[31] A. Tsymbal, “The problem of concept drift: definitions and related work,” Computer Science Department, Trinity College Dublin, 2004.
[32] G. Widmer and M. Kubat, “Learning in the presence of concept drift and hidden contexts,” Machine learning, vol. 23, no. 1, pp. 69–101, 1996.
[33] P. G. Campos Soto, “Recommender systems and time context: Characterization of a robust evaluation protocol to increase reliability of measured improvements,” 2013.
[34] P. Kefalas and Y. Manolopoulos, “A time-aware spatio-textual recommender system,” Expert Systems with Applications, vol. 78, pp. 396–406, 2017.
[35] F. Ricci, L. Rokach, and B. Shapira, Recommender Systems Handbook (2nd edt.). Springer, 2015.
[36] F. Ricci, L. Rokach, B. Shapira, and K. B. Paul, Recommender systems handbook. Springer, 2011, pp. 1–35.
[37] P. G. Campos, F. D?ez, and M. Sánchez-Montañés, “Towards a more realistic evaluation: testing the ability to predict future tastes of matrix factorization-based recommenders,” in Proceedings of the fifth ACM conference on Recommender systems, 2011, pp. 309–312.
[38] N. Lathia, S. Hailes, L. Capra, and X. Amatriain, “Temporal Diversity in Recommender Systems,” in Proceedings of the 33rd International ACM SIGIR Conference on Research and Development in Information Retrieval, 2010, pp. 210–217.
[39] N. K. Lathia, “Evaluating collaborative filtering over time,” UCL (University College London), 2010.
[40] J. Vinagre, A. M. Jorge, and J. Gama, “An overview on the exploitation of time in collaborative filtering,” Wiley Interdisciplinary Reviews: Data Mining and Knowledge Discovery, vol. 5, no. 5, pp. 195–215, 2015.
[41] X. Yingyuan, A. Pengqiang, H. Ching-Hsien, W. Hongya, and J. Xu, “Time-ordered collaborative filtering for news recommendation,” China Communications, vol. 12, no. 12, pp. 53–62, 2015.
[42] A. Gunawardana and G. Shani, “A survey of accuracy evaluation metrics of recommendation tasks,” The Journal of Machine Learning Research, vol. 10, pp. 2935–2962, 2009.
[43] D. Kluver and J. A. Konstan, “Evaluating recommender behavior for new users,” in Proceedings of the 8th ACM Conference on Recommender Systems, 2014, pp. 121–128.
[44] T. Jambor, J. Wang, and N. Lathia, “Using control theory for stable and efficient recommender systems,” in Proceedings of the 21st international conference on World Wide Web, 2012, pp. 11–20.
[45] C. Rana and S. K. Jain, “Building a Book Recommender system using time based content filtering,” WSEAS Transactions on Computers, vol. 11, no. 2, pp. 2224–2872, 2012.
[46] P. G. C. Soto, “Temporal models in recommender systems: An exploratory study on different evaluation dimensions,” Universidad Autónoma de Madrid Escuela Politécnica Superior, 2011.
[47] J. Beel, Z. Carevic, J. Schaible, and G. Neusch, “RARD: The Related-Article Recommendation Dataset,” D-Lib Magazine, vol. 23, no. 7/8, pp. 1–14, Jul. 2017.
[1] We use the term ‘effectiveness’ to describe to what extent a recommender system achieves its objective, which could be, for example, maximizing user satisfaction (measured e.g. through user ratings) or revenue. However, for this paper, it is not important what the actual objective of the recommender system is or which metric is used.
[2] Please note that for our argument, it would not matter if data is used from a real-world recommender system that implements the algorithms (as in our example), or if a researcher uses a dataset like the MovieLens dataset.


0 Comments